This briefing paper is part of the Understanding the Facts Series that provide background information on why and how conservatives should lead on climate change policy. The issues and approaches are rooted in CRES Forum’s Conservative Climate Policy Directives, which were developed to help policymakers and the public better understand which policies can reduce emissions while fostering economic growth for generations to come.
The CRES Forum Conservative Climate Policy Directives are:
- Keep all options on the table to reduce emissions
- Lower costs, don’t force prices up, unintentionally or by design
- Support American innovation
- Promote nature-based solutions
- Eliminate regulatory barriers
- Link foreign aid and trade to global emissions goals
- Encourage transparency and accountability
- Leverage public-private partnerships
Introduction
The U.S. power sector has been a model of success in reducing CO2 emissions. Due to its success in reducing emissions, as of 2016, the power sector is no longer the leading source of domestic emissions (Figure 1). Its emissions levels are at their lowest point in over three decades and are projected to continue decreasing at a rapid rate, even as electricity generation has remained steady (Figure 2). Partially a result of the pandemic, 2020 CO2 emissions from the power sector fell by 11 percent, reaching a historic low, but rebounded in 2021. Even with emissions moving up from 2020, the U.S. Energy Information Administration (EIA) expects 2022 emissions to be below the pre- pandemic 2019 levels, with 2019 being among the largest recent single year decreases. The level of achieved power sector reductions has exceeded the emissions reductions, in a shorter timeframe, than the EPA projected would have occurred as a result of its finalized, but never implemented, greenhouse gas regulations for the power sector, known as the Clean Power Plan (CPP).
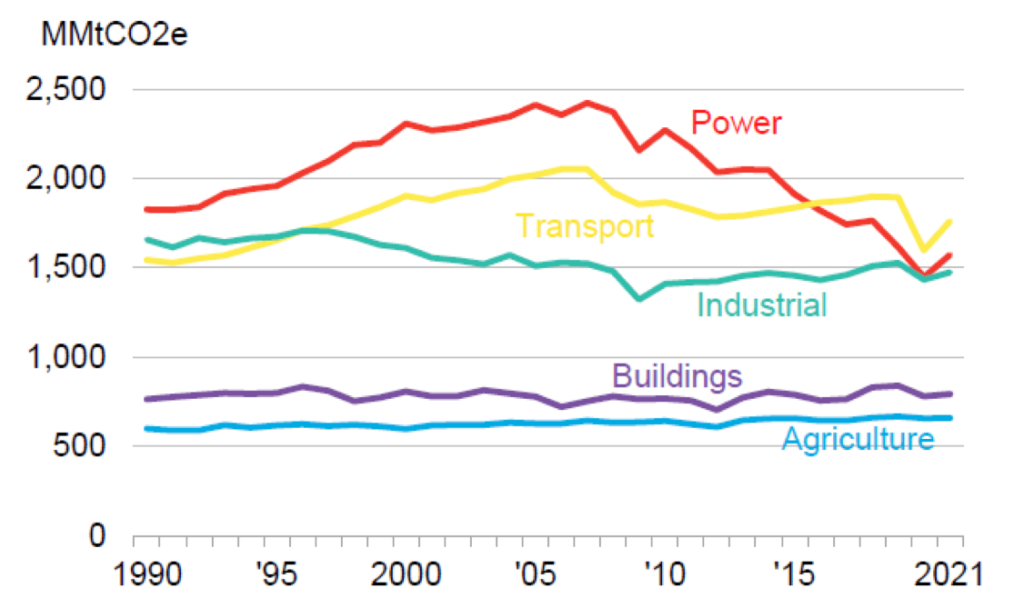
Figure 1. U.S. emissions by sector.
Source: 2022 Sustainable Energy in America Factbook, Business Council for Sustainable Energy (BCSE), https://bcse.org/factbook.
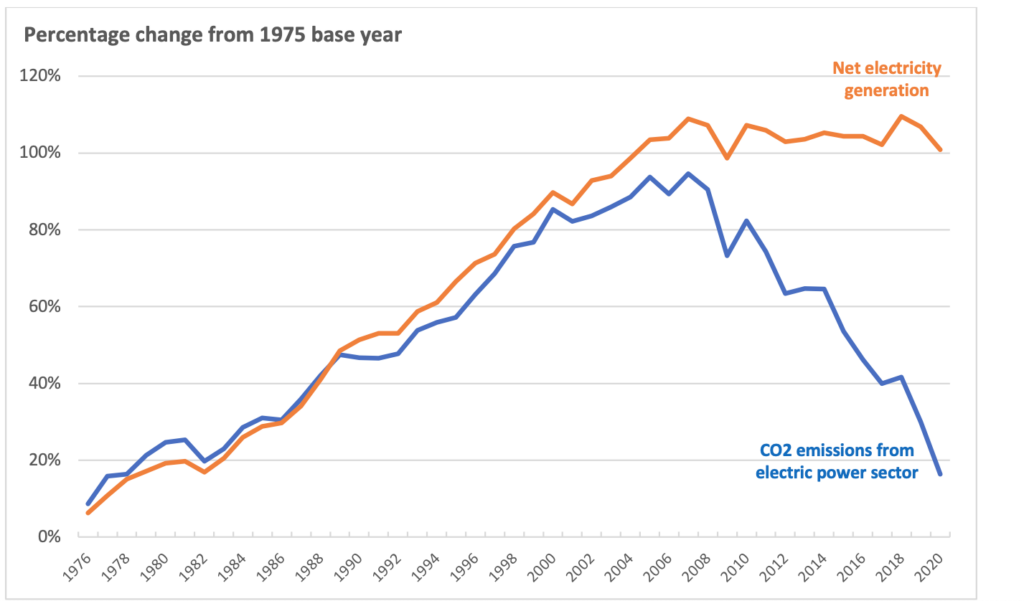
Figure 2. Percentage change of net electricity generation and CO2 emissions from electricity generation.
Source: “U.S. Carbon Dioxide Emissions in the Electricity Sector: Factors, Trends, and Projections,” Congressional Research Service, 7 January 2019, https://crsreports.congress.gov/product/pdf/R/R45453; and Monthly Energy Review, tables 7.2b and 11.6, U.S. Energy Information Administration (EIA), 24 February 2022, https://www.eia.gov/totalenergy/data/monthly/.
Building on past success, a growing number of market participants in the power sector are committing to net-zero emissions over the next three decades. Meeting those targets depends upon commercialization of affordable, innovative technologies, expanded energy infrastructure, continued efficiency gains, and retention of existing zero-emissions baseload generation.
In the U.S., the power sector has achieved substantial emissions reductions and is no longer the largest source of domestic emissions. However, the generation of electricity and heat remains the largest source of global emissions, which are expected to continue growing. An estimated 770 million people remained without access to electricity in 2019. Approximately 93 percent of global growth in emissions between 2020 and 2050 is projected to come from non-OECD nations, with much of that coming from power generation. Slowing the growth of global emissions related to electricity requires further global saturation of low-carbon technologies and resources. However, large-scale global reductions will only come with new innovative technologies that deliver reliable, resilient, and low- emitting energy at a cost affordable for non-OECD nations. Federal policies should prioritize fostering innovation and commercialization of affordable clean energy technologies that can both bolster the momentum of power sector emissions reductions at home and be exported to help reduce emissions in other countries with rapidly increasing demand for electricity.
The Facts
The U.S. power sector has seen significant transformation over the last two decades. With the advancement of innovative technologies that led to low-cost natural gas and further penetration of renewables, emissions levels from the generation of electricity continue to improve. According to Carnegie Mellon University’s Scott Institute for Energy Innovation, the carbon intensity of the U.S. power sector is down more than 38 percent since 2005. If U.S. demand growth had continued at its 2005 rate and emissions intensity had been fixed at 2005 levels, power sector emissions would be around 75 percent higher than they were in 2020. Instead, yearly power sector CO2 emissions decreased from 2,411 MMmt in 2005 to 1,548.79 MMmt in 2021, a 36 percent reduction (Figure 3).
According to Carnegie Mellon University’s Scott Institute for Energy Innovation, the carbon intensity of the U.S. power sector is down more than 38 percent since 2005.
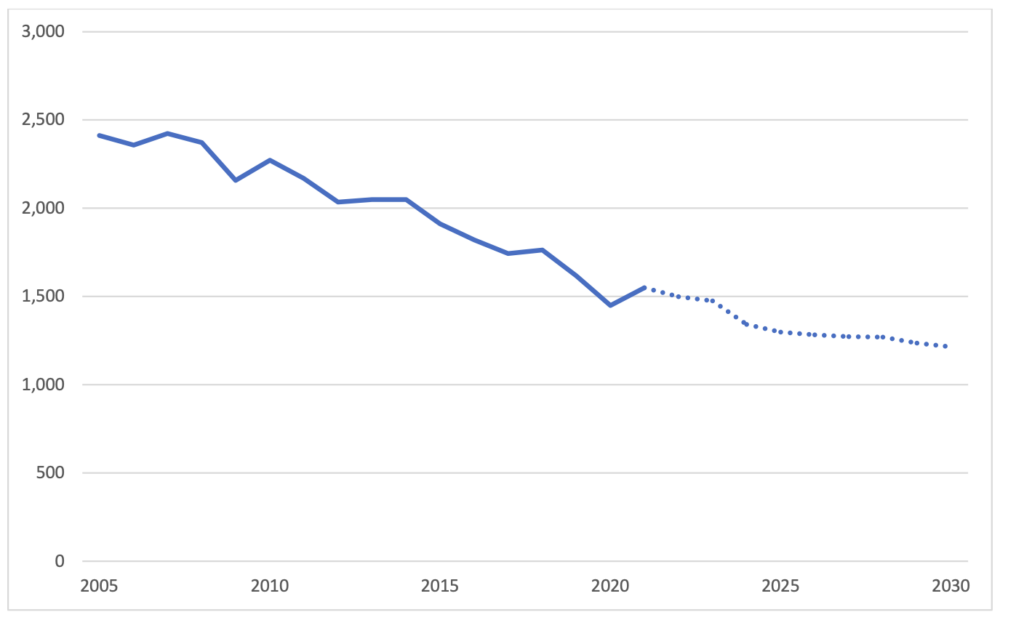
Figure 3: Power sector historical CO2 emissions (2005–2021) and projections (2022-2030)11
Source of data: U.S. EIA, “Electric power sector” (table 11.6), Monthly Energy Review, U.S. EIA, 27 January 2022, https://www.eia.gov/totalenergy/data/monthly/index.php#environment. For projections, U.S. EIA, Annual Energy Outlook 2021 (Table 18), https://www.eia.gov/outlooks/aeo/tables_ref.php.
To put that level of reduction achieved by the power sector into perspective, EPA’s 2015 Clean Power Plan (CPP) projected emissions reductions of 32 percent below 2005 levels by 2030 had the regulations been fully implemented (EPA pulled back the regulation in 2018 prior to implementation). Due largely to innovation, increased efficiency, and market forces, the power sector exceeded the targets of the CPP a decade early, achieving more, and affordable, benefits.
This decrease in U.S. emissions can be largely attributed to natural gas development and increased penetration of renewables. Innovative technologies and practices facilitated substantial increases in low-cost natural gas production, and other clean energy technology advances and policy support created favorable market conditions for renewable energy. From 2005 to 2020, the percentage of renewable energy increased by 124 percent, and the share of natural gas has increased 115 percent. Natural gas is estimated to be responsible for around 65 percent of U.S. emissions reductions between 2005 and 2019, with renewables accounting for 30 percent. In 2019, renewables produced more energy in the United States than coal for the first time.
In 2019, renewables produced more energy in the United States than coal for the first time.
Nuclear energy remains the largest source of zero-emissions energy generated in the United States—providing 49 percent of the total in 2020 (Figure 4). However, from 2013 to 2021, twelve nuclear reactors shut down in the United States, removing nearly 10 GW of zero-emissions baseload electricity generation capacity. An additional 7,109 MW of nuclear generating capacity, or 7.4 percent of existing nuclear capacity, has been announced for shutdown. Preservation of existing nuclear plants is vital to continued emissions success of the power sector.
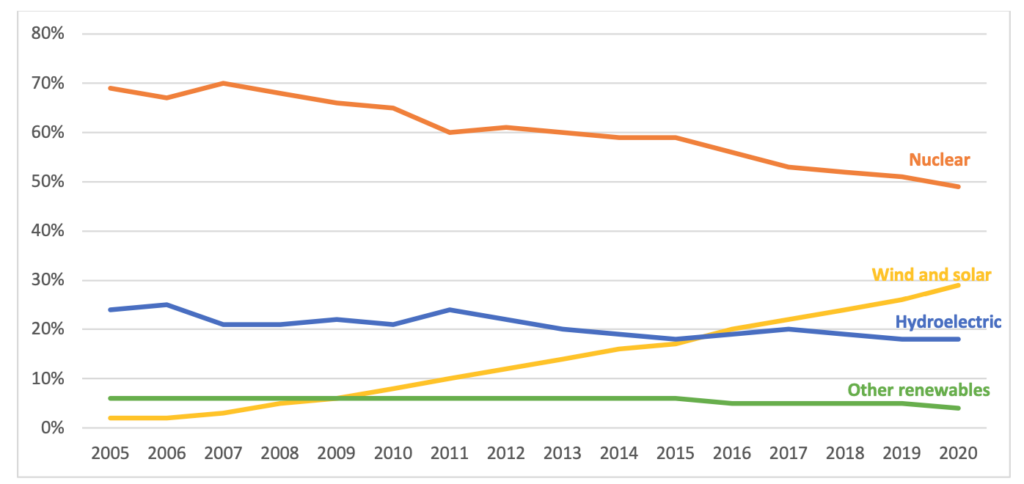
Figure 4. Annual percentage of zero-emissions generation by source.
Source of data: “U.S. Energy-Related Carbon Dioxide Emissions, 2020,” U.S. Energy Information Administration, 22 December 2021, https://www.eia.gov/environment/emissions/carbon/.
The percentage of electricity generated by renewables has gone from 13 percent in 2011 to 21 percent in 2021, and the share of natural gas has increased from 25 to 38 percent (Figure 5). The share of coal-fired generation has consistently decreased over time, although it did rebound slightly during 2021 due to higher natural gas prices. Coal continues to play an important, albeit shrinking, role in domestic energy production; globally, it remains a much-utilized resource for existing and planned energy production.
Integration of new technologies and resources provides further opportunity for grid resilience, reduced costs, and reduced emissions. As noted in a recent Ernst & Young utility report, changes in the power sector go beyond the utility-scale generation of electricity:
The power and utilities sector faces radical transformation. Distributed renewable generation, new digital technologies, and changing consumer expectations are creating a new energy world that is more complex, competitive and challenging. And it’s coming faster than you think.
The power and utilities sector faces radical transformation. Distributed renewable generation, new digital technologies, and changing consumer expectations are creating a new energy world that is more complex, competitive and challenging. And it’s coming faster than you think.
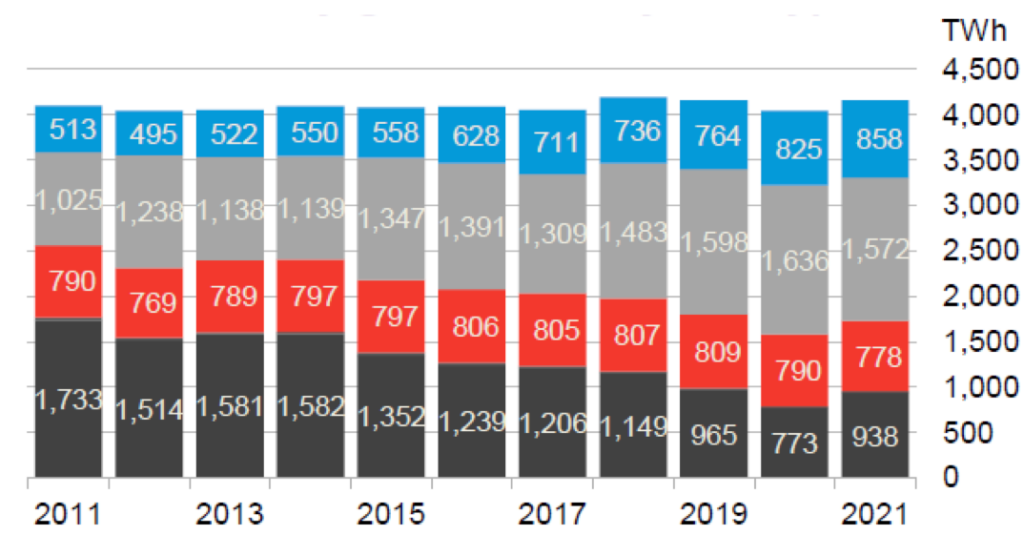
Figure 5. U.S. electricity generation, by fuel type, 2011-2021.
Source: 2022 Sustainable Energy in America Factbook, Business Council for Sustainable Energy (BCSE), https://bcse.org/factbook/.
DOUBLING DOWN ON OUR SUCCESS
All indications point to U.S. power sector emissions declining further, with utilities setting expectations of long-term and large-scale reductions. These pathways are reflected in aggressive goals by the largest utilities, some of which are aiming at net-zero emissions by 2050.
For example, Duke Energy, the largest investor-owned utility in the United States, set a goal in 2019 to achieve net-zero carbon emissions by 2050, and expanded it in February of 2022 to include Scope 2 as well as some Scope 3 emissions; and the company also committed to sourcing less than 5 percent of its energy from coal by 2035. Duke is not alone—nearly every major utility in the United States has now set some sort of carbon reduction commitment (Figure 6 and Table 1).
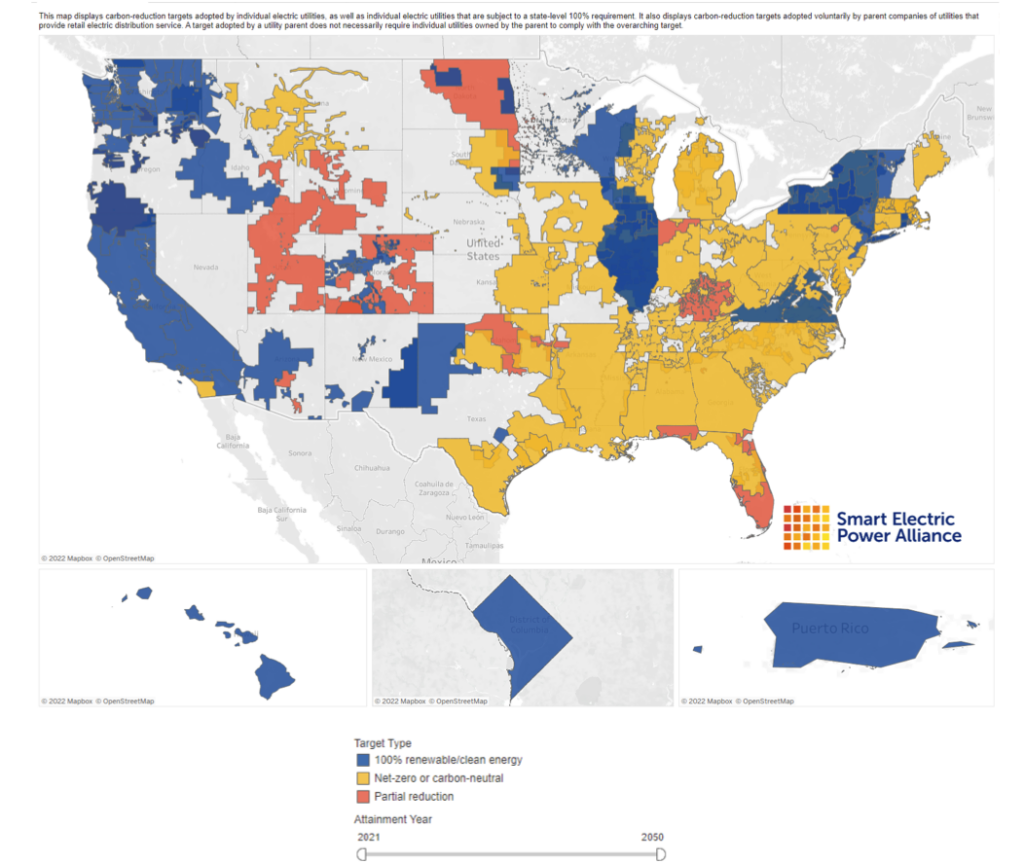
Figure 6. Utilities’ path to a carbon-free energy system.
Source: Smart Electric Power Alliance, https://sepapower.org/utility-transformation-challenge/utility-carbon-reduction- tracker/.
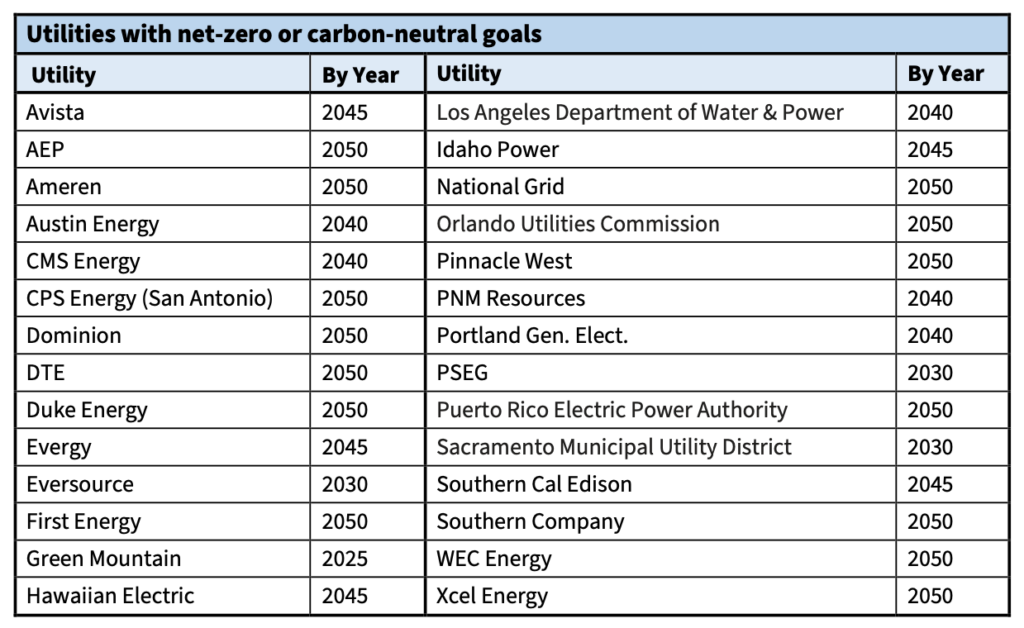
Table 1: List of utilities with ambitious emission targets.
To achieve power sector decarbonization, the federal government has an important role in helping foster innovation advancements and the development of transformative, next-generation technologies. Federal action is also crucial for reducing barriers to the infrastructure necessary to move energy (including natural gas and electric transmission). Additionally, the federal government should take steps to safely extend the life of existing zero-emission nuclear power plants, including license extensions by the Nuclear Regulatory Commission (NRC). The NRC also has an important role in ensuring an efficient licensing process for new, advanced nuclear reactor designs.
The federal government has an important role in helping foster innovation advancements and the development of transformative, next-generation technologies.
Even as we look to federal policy to ensure an affordable clean energy strategy, state governments also play an important role, as vital incubators of policy innovation, and present opportunities to test novel approaches to increase investment in clean energy and drive down emissions. In many cases, state and local policy will drive the most locally appropriate solutions. For example, just under three quarters of U.S. states have either a voluntary or mandatory Renewable Portfolio Standard (RPS) or Clean Energy Standards (CES), tailored to circumstances of the individual state based on their resources as well as allowing them to leverage technologies more readily available to them. As a general principle, the federal government should avoid undermining state efforts to design and implement energy strategies consistent with the assets and needs of the individual state.
Even as we look to federal policy to ensure an affordable clean energy strategy, state governments also play an important role, as vital incubators of policy innovation, and present opportunities to test novel approaches to increase investment in clean energy and drive down emissions.
The federal government’s role does not require or depend upon increasing the cost of electricity through new mandates, regulations, or taxes. Ironically, poorly designed policies could stifle the innovation of low-cost technologies necessary to affordably achieve the long-term emissions reduction goals within the power sector. Stifling low-cost, innovative technologies and resources will also reduce the ability to deliver affordable low-emissions options to the global market. Under a worst-case scenario, flawed federal policies that result in higher energy costs would lead to a loss of
U.S. manufacturing in energy-intensive sectors and a net increase in global emissions as those economic activities are offshored to less efficient producers.
The federal government’s role does not require or depend upon increasing the cost of electricity through new mandates, regulations, or taxes. Ironically, poorly designed policies could stifle the innovation of low-cost technologies necessary to affordably achieve the long-term emissions reduction goals within the power sector.
European countries have long instituted energy policies that have increased the cost of energy and increased reliance on foreign suppliers of energy. For example, the cost of electricity in Germany, even prior to energy prices spikes in 2021, was three times higher than electricity prices in the United States. And yet, from 2005–2020, the United States reduced its emissions more than all members of the EU-28 combined. At the same time, EU reliance on natural gas from Russia has increased.
Because of the way we currently account for emissions, the emissions associated with producing and delivering that natural gas from Russia to the EU are not counted as EU emissions. It is worth noting that the lifecycle emissions associated with Russian natural gas exported to Europe are 41 percent higher than if the EU were to import Liquefied Natural Gas (LNG) from the United States. The United States must be cautious to avoid a path that increases energy costs, merely offshores emissions, and increases reliance on adversarial nations, whether it is oil and gas from Russia or critical minerals from China.
For example, efforts to restrict new natural gas infrastructure have led New England to continue its reliance on high-emitting and expensive heating oil, or even importing Russian natural gas to meet its energy needs, such as occurred in 2018. The New England Independent System Operator has noted that natural gas availability has had an environmental and economic benefit to New England, and deficient pipeline and other natural gas infrastructure constraints have resulted in higher costs and pollution.
Costs for zero- and low-carbon energy sources have continually come down, and their market competitiveness increases every year. New-build clean energy is more competitive today than any time in the past (Figure 7). Technological advances, component cost decreases, and federal and state support for innovation in the renewable energy and natural gas sectors, for example, have contributed to dramatic cost decreases in these sectors in the U.S. Between 2010 and 2019, the Levelized Cost of Electricity (LCOE) for utility-scale solar photovoltaic systems in the U.S. declined by 71 percent, from $204/MWh to $59/MWh. The LCOE of onshore wind projects in the U.S. over the same time period decreased by 57 percent, from $91 in 2010 to $39 in 2019. The drop in the electric power price of natural gas, responsible for the largest share in power sector emissions reductions, was also substantial, having decreased by 43 percent between 2010 and 2019, from $5.27 to $2.99 per thousand cubic feet (74 percent if comparing 2019 with natural gas’ peak price of $9.26 in 2008). Both renewable and natural gas prices experienced a drop in 2020, mostly related to the economic effects of the COVID-19 pandemic.
Virtually all commodities saw substantial cost increases in 2021, however, with energy leading the way. Prior to Russia’s invasion of Ukraine, the U.S. Energy Information Administration (EIA) had forecast that natural gas prices in the U.S. would remain relatively stable over 2022 (despite the 2021 surge), and decrease slightly during 2023, due to predicted growth in U.S. natural gas production, relatively stable domestic consumption, and the expectation of slight increases in U.S. LNG exports to Mexico, Canada, as well as overseas. It is unclear, however, what the long-term impact of Russia’s invasion of Ukraine might have on the U.S. energy mix and electricity prices. Vladimir Putin’s actions have crystallized the importance of energy security and reduced reliance on adversarial nations for energy.

Figure 7. U.S. levelized costs of electricity (unsubsidized for new build, 2H 2021). The Levelized Cost of Electricity (LCOE) refers to the cost of building and maintaining a power plant over an assumed lifetime.36 It allows for cost comparison across different energy technologies.
Source:2022 Sustainable Energy in America Factbook, Business Council for Sustainable Energy (BCSE), https://bcse.org/factbook, and “Levelized Cost of Energy,” DOE.
To ensure affordable and reliable power, while also prioritizing emissions performance, there is no silver bullet. Flexibility, creativity, and innovation are keys to success, especially as broader efforts will likely see an increasingly electrified economy. Among the most important actions the federal government can focus on is that of reducing the obstacles that slow down deployment of innovative technologies and energy infrastructure. Permitting that moves at the speed of bureaucracy will undermine the ability of the power sector to continue, and accelerate, its emissions-reducing path. Every day delayed is increased emissions and higher costs.
Among the most important actions the federal government can focus on is that of reducing the obstacles that slow down deployment of innovative technologies and energy infrastructure.
GLOBAL EMISSIONS MATTER
Addressing climate change goes beyond just reducing domestic emissions—it requires global solutions. Clean energy innovation is not just a domestic priority for the power sector; it is a global necessity. In 2019, the United States was responsible for 11 percent of global CO2 emissions, a share which is projected to continue declining. By 2050, the EIA estimates that non-OECD nations will account for just over 70 percent of global CO2 emissions. It also projects that global energy consumption in the electric power sector will increase from 2020’s 235.8 quadrillion Btu (quads) to 365.9 quads by 2050—a 55 percent increase. This demand is primarily driven by improving living standards and rising energy demand in the developing world, as well as developed economies increasingly relying on electrification.
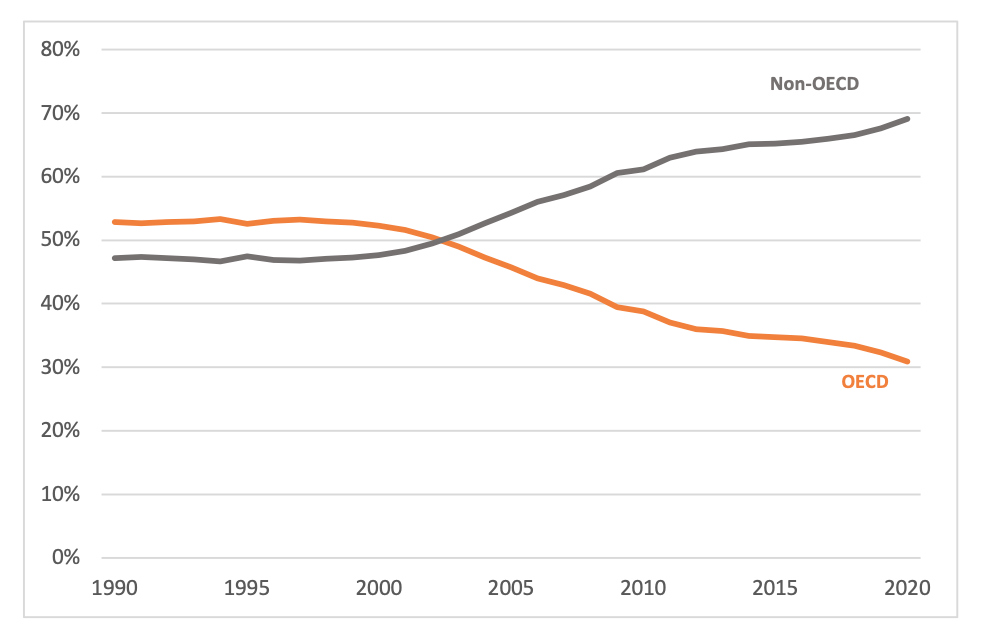
Figure 7. Global share of CO2 Emissions, OECD vs non-OECD
Source of data: European Commission Emissions Database for Global Atmospheric Research (EDGAR), https://edgar.jrc.ec.europa.eu/report_2021.
For many countries, replacing unabated fossil fuels with alternatives comes at a premium. For example, a study cited in the Intergovernmental Panel on Climate Change’s Special Report estimated that using today’s renewable energy and efficiency technology to pursue a 1.5-degree target would cost an additional $550 billion per year globally. For non-OECD nations, which have a GDP per capita roughly one-fifth of that of the United States and limited capital to spend more than is necessary for each megawatt of delivered electricity, expensive energy transitions may not be a viable option. This global reality should influence how we think about clean energy technologies, with a focus on affordably reducing emissions from the energy sources that will play a significant role in the global energy future, including fossil resources.
Conclusion
Federal policies should recognize the success to date in decarbonizing the power sector and should enhance, not hinder, that continued path of success. The government is rarely effective at picking winners and losers in the market, and policies that ignore the innovation arc or divert resources from what is ultimately necessary to reduce both domestic power sector emissions and global emissions should be avoided. Action should be focused on innovative technologies that reduce emissions while maintaining reliability and affordability, and not on any specific energy source.
Viewing power sector emissions reductions only through a domestic lens is not sufficient to move the needle on global emissions. Climate policies should focus on actions that can be leveraged to reduce global emissions and avoid their projected increase. Developing nations will prioritize electricity access, affordability, and alleviating poverty over climate-related objectives. Policies that result in or rely on sustained higher cost for delivered electricity will face adoption obstacles globally. Not only will these policies come with a high economic cost to the United States, but they will also delay what is required to meaningfully address global emissions and reduce the risk of climate change. The key to reducing global emissions from the power sector will come from new technologies that are as cheap or cheaper than incumbent energy sources. Just as the United States has had significant innovation- driven declines, the support of other technological advances that offer a cost-competitive choice will be essential to decarbonizing foreign electricity production.
Innovation in electric power generation, though, is most likely to originate in the United States—just as it has in the past with renewables, nuclear power, and fossil technology. The United States not only invests more in energy innovation than any other nation, but it is also home to markets that stimulate private sector investment and adoption of innovation. America should embrace the comparative advantages that the U.S. electric power sector has, creating solutions that will become exportable and affordable overseas.
